Posted By University of Wisconsin-Madison
The classic reference on this topic is Baron, R. M., & Kenny, D. A. (1986). The moderator-mediator variable distinction in social psychological research: Conceptual, strategic, and statistical considerations. Journal of Personality and Social Psychology, 51, 1173-1182.
Most of what is written here comes directly from this classic paper.
* Moderator variables - "In general terms, a moderator is a qualitative (e.g., sex, race, class) or quantitative (e.g., level of reward) variable that affects the direction and/or strength of the relation between an independent or predictor variable and a dependent or criterion variable. Specifically within a correlational analysis framework, a moderator is a third variable that affects the zero-order correlation between two other variables. ... In the more familiar analysis of variance (ANOVA) terms, a basic moderator effect can be represented as an interaction between a focal independent variable and a factor that specifies the appropriate conditions for its operation." p. 1174
* Mediator variables - "In general, a given variable may be said to function as a mediator to the extent that it accounts for the relation between the predictor and the criterion. Mediators explain how external physical events take on internal psychological significance. Whereas moderator variables specify when certain effects will hold, mediators speak to how or why such effects occur." p. 1176
The general test for mediation is to examine the relation between the predictor and the criterion variables, the relation between the predictor and the mediator variables, and the relation between the mediator and criterion variables. All of these correlations should be significant. The relation between predictor and criterion should be reduced (to zero in the case of total mediation) after controlling the relation between the mediator and criterion variables.
Another way to think about this issue is that a moderator variable is one that influences the strength of a relationship between two other variables, and a mediator variable is one that explains the relationship between the two other variables. As an example, let's consider the relation between social class (SES) and frequency of breast self-exams (BSE). Age might be a moderator variable, in that the relation between SES and BSE could be stronger for older women and less strong or nonexistent for younger women. Education might be a mediator variable in that it explains why there is a relation between SES and BSE. When you remove the effect of education, the relation between SES and BSE disappears.
Source: http://psych.wisc.edu/henriques/mediator.html
Saturday, August 28, 2010
Thursday, August 26, 2010
International Higher Education 2010 Conference in Perth, Australia

IADIS International Conference on International Higher Education 2010
29, 30 November and 1 December 2010 – Perth, Australia
Call for Papers
Technology like transport, communication and media-based learning have increased our ambitions to make education more global and international. Higher education has gradually felt more affinity towards the exchange of students; Diversity and learning in concentration with different cultures that has settled as road map for the coming decades. Firstly, motivation for international higher education to promote students’ mindset towards different cultures, languages and traditions. Secondly, allowing students to learn multi-cultural contexts to anticipate to the later career that involve cooperation in international teams. As inevitable side effect, universities welcome international students as source of income and exchange knowledge and skills. To be more precisely, students will take part of their courses abroad, and at least they should match a similar amount of incoming students in order to play par.
This conference aims at the scientific, pragmatic and policy awareness among scholars who face the direct need to make their curricula more culturally fair. European exchange programs like the Erasmus Mundus, the U.S. Council on International Educational Student Exchange, and the Euro-American “Atlantis” program, they all envisage an urgent agenda on how to balance local with the more global criteria in higher education. This conference helps you to build your networks and international consortia on how to be a key player in this emergent trend.
Though not exclusive, the next topics are welcome for papers, posters, symposia and forums
1. Technologies for spreading learning around the world
2. Higher Education and International student exchange
3. Learning far away from home and close to your future colleagues
4. Learning in multicultural contexts
5. Virtual presence as option for extending the students’ learning space
6. Formal and pragmatic obstacles and opportunities in student exchange programs
7. Double- versus joint degrees
8. Funding resources for staff and student exchange
9. How to establish campuses as multicultural communities
10. Coping with incompatibility in semester-, trimester and quarter year course periods
11. Trade-offs between student exchange in the bachelor- versus the master stage?
12. Will English be the default language for master courses around the globe?
13. Does studying abroad imply “living together with local students”, or prefer “international student houses”?
14. How to recruit highly talented students abroad?
15. How to defend the yielded higher criterion to the access of regional- and local students?
16. How to evaluate students’ readiness for studying abroad?
17. Acculturation: what preliminary intercultural need to be trained before been sent to a study abroad?
This conference will focus both on the acute main streams of student exchange:
- Eastern Asia to Europe, the U.S., Australia and New Zealand
- Among Western and Eastern European countries
- Among Spain, Portugal and Southern American countries
- Among Europe and the U.S.
The Conference will be composed of several types of contributions:
* Full Papers – These include mainly accomplished research results and have 8 pages at the maximum (5,000 words).
* Short Papers – These are mostly composed of work in progress reports or fresh developments and have 4 pages at maximum (2,500 words).
* Reflection Papers – These might review recent research literature pertaining to a particular problem or approach, indicate what the findings suggest, and/or provide a suggestion - with rationale and justification - for a different approach or perspective on that problem. Reflection papers might also analyze general trends or discuss important issues in topics related to Applied Computing. These have two pages at maximum (1500 words).
* Posters / Demonstrations – These have one page at the maximum (625 words) besides the poster itself (or demonstration) that will be exposed at the conference.
* Tutorials – Tutorials can be proposed by scholars or company representatives. A proposal of maximum 250 words is expected.
* Panels – Discussions on selected topics will be held. A proposal of maximum 250 words is expected.
* Invited Talks – These will be made of contributions from well-known scholars and company representatives. An abstract will be included in the conference proceedings.
* Doctoral Consortium - The Doctoral Consortium will discuss on going work of PhD students in an informal and formative atmosphere. Contributions to the consortium should take the form of either:
- a critical literature review of the research topic providing the rationale for the relevance and interest of the research topic; or
- a short paper discussing the research question(s), research objectives, research methodology and work done so far.
Doctoral Consortium Contributions should have a maximum 2,500 words (4 pages).
* Corporate Showcases & Exhibitions – The former enables Companies to present recent developments and applications, inform a large and qualified audience of your future directions and showcase company’s noteworthy products and services. There will be a time slot for companies to make their presentation in a room. The latter enables companies the opportunity to display its latest offerings of hardware, software, tools, services and books, through an exhibit booth. For further details please contact the publicity chair - secretariat@ihe-conf.org.
This is a blind peer-reviewed conference.
Important Dates:
- Submission Deadline (2nd call): 6 September 2010
- Notification to Authors (2nd call): 6 October 2010
- Final Camera-Ready Submission and Early Registration (1st call): Until 28 July 2010
- Late Registration (1st call): After 28 July 2010
- Conference: Perth, Australia, 29, 30 November and 1 December 2010
For more details: http://www.ihe-conf.org/
Sunday, August 22, 2010
Get your research works organized with Mendeley

Organize your own research library
Mendeley Desktop is academic software that indexes and organizes all of your PDF documents and research papers into your own personal digital bibliography. It gathers document details from your PDFs allowing you to effortlessly search, organize and cite. It also looks up PubMed, CrossRef, DOIs and other related document details automatically. Drag and drop functionality makes populating the library quick and easy. The Web Importer allows you to quickly and easily import papers from resources such as Google Scholar, ACM, IEEE and many more at the click of a button.
Share with other researchers
Collaborate with fellow researchers and share information, resources and experiences with shared and public collections. Your research team will have easy access to each others papers. Just create a group, invite your colleagues and drag and drop documents in there. This way you can keep on top of what they're reading and discover more about what interests you.
Discover new research and trends
Through the Mendeley research network you can connect with other researchers in your field. This opens up a whole new avenue for knowledge discovery. You can view the most read authors, journals and research papers in your field. You can explore by using tags associated with your research area. By navigating the web of knowledge available to you, you make some useful contacts along the way too. In addition to that, you can also view interesting statistics about your own digital library.
Sign up and download today. It's FREE. Details at: http://www.mendeley.com/
3rd International Conference on Teaching and Learning

About ICTL 2011:
INTI International University is organising a biennial International Conference on Teaching and Learning (ICTL 2011). This 3-day conference aims to provide a forum for educators, researchers, technologists and students to share their knowledge and expertise in teaching and learning; to stimulate high quality research work in teaching and learning so as to develop state-of-the-art educational technologies; and to promote intellectual discourse among the conference participants from the United Kingdom, United States, Canada, Australia, New Zealand, Europe and Asia. Over 350 participants from overseas and local universities or higher education institutions are expected to attend the conference.
Conference Theme:
Towards 21st Century Education: Student – Student Collaboration
Conference Venue and Date:
November 14 - 16, 2011
PARKROYAL Penang Hotel
Penang, Malaysia
All researchers, educators and technologists around the world are invited to contribute papers in this conference. Papers, not published elsewhere, are invited in the following topics:
* Instructional Strategy
* Instructional Technology
* E-Learning
* Assessment and Evaluation
* Classroom Management
For details on conference topic: http://ictl.intimal.edu.my/html_topics.php
Important Dates:
Call for papers: June 1, 2010
Proposal Due: April 29, 2011
Authors Notified: May 31, 2011
Early Registration Deadline: August 31, 2011
Proceeding Files Deadline: August 15, 2011
For further details: http://ictl.intimal.edu.my/index.php
2nd INTERNATIONAL CONFERENCE on BUSINESS and ECONOMIC RESEARCH- ICBER
2nd INTERNATIONAL CONFERENCE on BUSINESS and ECONOMIC RESEARCH- ICBER

DATE: 14-15 March 2011
VENUE: Holiday Villa Beach Resort and Spa, Langkawi Kedah, Malaysia
ISBN PROCEEDING: 978-967-5705-01-4
Important Dates:
SUBMIT PAPER TO: icber@internationalconference.com.my
ABSTRACT SUBMISSION DEADLINE: 16 Feb 2011
NOTIFICATION OF ABSTRACT ACCEPTANCE: 30 Feb 2011
FULL PAPER SUBMISSION DEADLINE: 20 Feb 2011
FINAL PAPER DUE: 10 Feb 2011
Theoerical and empirical papers in all areas of Accounting, Banking, Ecomonics, Finance, Management and Marketing are invited for the above International Conference. Please refer to the Major Field of Research. All papers will undergo double blind peer review process and all accepted papers will be published in the Refereed Conference Proceedings with an ISBN. "Best Paper Winners" will be selected from a block papers in each track and winners will receive a cerificate and their papers will be considered to be published in the "Journal of International Conference on Business and Economics Research" subject to compliance to their guidelines and conditions.
SESSION CHAIR
Participants may serve as the Session Chair. If you are interested, please indicate your willingness in the Registration Form. A certificate will be issued to all Chairs acknowledging their role at the conference.
For details: http://www.internationalconference.com.my/icber/icber.htm

Basic AMOS
AMOS is statistical software and it stands for analysis of a moment structures. AMOS is an added SPSS module, and is specially used for Structural Equation Modeling, path analysis, and confirmatory factor analysis. It is also known as analysis of covariance or causal modeling software. AMOS is a visual program for structural equation modeling (SEM). In AMOS, we can draw models graphically using simple drawing tools. AMOS quickly performs the computations for SEM and displays the results.
In calculation of SEM coefficients, AMOS uses the following methods:
* Maximum likelihood
* Unweighted least squares
* Generalized least squares
* Browne’s asymptotically distribution-free criterion
* Scale-free least squares
Construction of model in AMOS:
First, we have to run AMOS. By clicking the “start” menu and selecting the “AMOS graphic” option from AMOS, we can run AMOS. The moment AMOS starts running, a window appears called the “AMOS graphic.” In this window, we can manually draw our SEM model.
Attaching data in AMOS: By selecting a file name from the data file option, we can attach data in AMOS for SEM analysis. This option also appears if we will click on the “select data” icon.
Observed variable: In AMOS, a rectangle icon is used to draw the observed variable.
Unobserved variable: In AMOS, a circle icon is used to draw the unobserved variable.
Cause effect relationdship: A single headed arrow in AMOS is used to draw the cause effect relationship between the observed and unobserved variables.
Covariance: A double headed arrow is used in AMOS to draw the covariance between variables.
Error term: In AMOS, the error term icon is next to the unobserved variable icon, and it is used to draw the latent variable.
Naming the Variable: When we right click on a variable in a graphical window, the first option, “object properties,” is used to give the name of the varible in AMOS.
There are other icons as well, and these icons help in drawing the SEM model graphically. Icons such as erase icon, moving icon, caculate icon, view text, analysis properties, etc., help in drawing the SEM model graphically.
Understanding the text output in AMOS: After running the analysis, we can see the results on the graphic window. We can also see the text output. The graphic window will only show the standardized and unstandrized regressions and error term weights. All results will be shown in the text output.
AMOS will produce the following important output:
Variable Summary: In AMOS and its text output variable summery, we can see how many variables and which variables are used for SEM analysis. We can see how many observerd variables and how many unobserved variables were in the model.
Accessing the normality: In SEM model, data should be normaly distributed. AMOS will give the text output, and Skewness, Kurtosis and Mahalanobis d-squared test will tell us about the normality of the data.
Estimates: In AMOS text output, the estimate option will give the result for regression weight, standardized loading for factor, residual, correlation, covariance, direct effect, indirect effect, total effect, etc.
Modification index: In AMOS text output, the modification index result shows the reliability of the path drawn in the SEM model. If MI index value is large, then we can add more paths to the SEM model.
Model fit: In AMOS text output, Model fit option will give the result for goodness of fit model statistics. It will show all the goodness of fit indexes, such as GFI, RMR, TLI, BIC, RMSER, etc.
Error message: If there is any problem, during the process of drawing the model (for example, if we forget to draw the error term or if we draw the covariance between two variables, or if missing data is present), then AMOS will either not calculate the result or it will give an error message.
Source: http://www.statisticssolutions.com/statistics-software/amos/
Structural equation modeling
Structural equation modeling is a multivariate statistical analysis technique that is used to analyze structural relationships. Structural equation modeling technique is the combination of factor analysis and multiple regression analysis, and it is used to analyze the structural relationship between measured variables and latent constructs. Structural equation modeling is preferred by the researcher because it estimates the multiple and interrelated dependence in a single analysis.
In structural equation modeling, two types of variables are used endogenous variables and exogenous variables. In structural equation modeling, endogenous variables are equivalent to dependent variables. In structural equation modeling, exogenous variables are equal to the independent variable.
Structural equation modeling and theory:
In structural equation modeling, theory can be thought of as a set of relationships providing consistency and comprehensive explanations of the actual phenomena. Structural equation modeling consists of two types of models:
1. Measurement model: In structural equation modeling, the measurement model represents the theory that specifies how measured variables come together to represent the theory.
2. Structural model: In structural equation modeling, the structural model represents the theory that shows how constructs are related to other constructs.
Structural equation modeling is also called casual modeling because structural equation modeling tests the proposed casual relationships. The following assumptions are assumed in structural equation modeling:
1. Multivariate normal distribution: In structural equation modeling, the maximum likelihood method is used and assumed for multivariate normal distribution. Small changes in multivariate normality can lead to a large difference in the chi-square test.
2. Linearity: In structural equation modeling, a linear relationship is assumed between endogenous and exogenous variables.
3. Outlier: In structural equation modeling, data should be free of outliers. Outliers affect the model significance.
4. Sequence: In structural equation modeling, there should be a cause and effect relationship between endogenous and exogenous variables, and a cause has to occur before the event.
5. Non-spurious relationship: In structural equation modeling, observed covariance must be true.
6. Model identification: In structural equation modeling, equations must be greater than the estimated parameters or models should be over identified or exact identified. Under identified models are not considered in structural equation modeling.
7. Sample size: In structural equation modeling, most of the researchers prefer a 200 to 400 sample size with 10 to 15 indicators. As a rule of thumb, that is 10 to 20 times as many cases as variables.
8. Uncorrelated error terms: In structural equation modeling, error terms are assumed uncorrelated with other variable error terms.
9. Data: Interval data is used in structural equation modeling.
The following steps are involved in structural equation modeling:
1. Defining individual constructs: The first step in structural equation modeling is to define the constructs theoretically. Conduct a pretest to evaluate the item. A confirmatory test of the measurement model is conducted using CFA.
2. Developing the overall measurement model: In structural equation modeling, the measurement model is also known as path analysis. Path analysis is a set of relationships between exogenous and endogens variables. This is shown by the use of an arrow. The measurement model follows the assumption of unidimensionality. Measurement theory is based on the idea that latent constructs cause the measured variable and that the error term is uncorrelated within measured variables. In a measurement model, an arrow is drawn from the measured variable to the constructs.
3. Design the study to produce the empirical results: In this step of structural equation modeling, the researcher must specify the model. The researcher should design the study to minimize the likelihood of an identification problem. In structural equation modeling, order condition and rank condition methods are used to minimize the identification problem.
4. Assessing the measurement model validity: In structural equation modeling, assessing the measurement model is also called CFA. In CFA, a researcher compares the theoretical measurement against the reality model. In structural equation modeling, the result of the CFA must be associated with the constructs’ validity.
5. Specifying the structural model: In this step of structural equation modeling, structural paths are drawn between constructs. In the structural model, no arrow can enter an exogenous construct. A single-headed arrow is used to represent a hypothesized structural relationship between one construct and another. This shows the cause and effect relationship. In structural equation modeling, each hypothesized relationship uses one degree of freedom. In structural equation modeling, the model can be recursive or nonrecursive.
6. Examine the structural model validity: In the last step of structural equation modeling, a researcher examines the structural model validity. In structural equation modeling, a model is considered a good fit if the value of the chi-square test is insignificant, and at least one incremental fit index (like CFI, GFI, TLI, AGFI, etc.) and one badness of fit index (like RMR, RMSEA, SRMR, etc.) meet the predetermined criteria.
Source: http://www.statisticssolutions.com/methods-chapter/statistical-tests/structural-equation-modeling/
Path Analysis
In statistics analysis, path analysis is considered an extension of the regression model. In a path analysis model from the correlation matrix, two or more casual models are compared. In path analysis, the path of the model is shown by a circle and an arrow, which shows the causation. In path analysis, regression weight is predicated by the model, and is compared by the observed correlation matrix. Then the goodness of fit statistic is calculated in order to see the fitting of the model.
Key concepts and terms in path analysis:
Estimation method in Path analysis: In path analysis, simple OLS and maximum likelihood methods are used to predict the path.
Path model: In path analysis, a path model is a diagram which shows the independent, intermediate, and dependent variable. In path analysis, a single headed arrow shows the cause for the independent, intermediate and dependent variable. A double headed arrow shows the covariance between the two variables.
Exogenous and endogenous variables in path analysis: In path analysis, exogenous variables in a path model are those where no error points towards them, except the measurement error term. If exogenous variables are correlated to each other, then a double headed arrow will connect those variables. Endogenous variables may have both the incoming and outgoing arrows.
Path coefficient: In path analysis, a path coefficient is a standardized regression coefficient (beta), showing the direct effect of an independent variable on a dependent variable in the path model.
Disturbance terms: The residual error terms are also called disturbance terms in path analysis. Disturbance terms reflect the unexplained variance and measurement error.
Direct and indirect effect in path analysis: In path analysis, the path model has two types of effects. The first is the direct effect, and the second is the indirect effect. When the exogenous variable has an arrow directed towards the dependent variable, then it is said to be the direct effect. When an exogenous variable has an effect on the dependent variable, through the other exogenous variable, then it is said to be an indirect effect. To see the total effect of the exogenous variable, we have to add the direct and indirect effect. In path analysis, one variable may not have a direct effect, but it may have an indirect effect.
Significance and goodness of fit in path analysis: OLS and maximum likelihood methods are used to predict the path coefficient in path analysis. These days, statistical software like AMOS, SAS and LISREL, etc. are software that calculates the path coefficient and goodness of fit statistics automatically.
The following statistics are used to test the significance and goodness of fit of path analysis:
Chi-square statistics: Non-significant chi-square value in path analysis shows the goodness of fit model. Sometimes, chi-square statistics is significant. However, we still have to test one absolute fit index and one incremental fit index.
Absolute fit index: RMSEA: An absolute fit index using 90% confidence interval for RMSEA should be less than 0.08 for a goodness of fit model.
Increment fit index: CFI, GFI, NNFI, TLI, RFI and AGFI, etc. are some incremental fit indexes, which should be greater than 0.90 for a goodness of fit model.
Modification indexes: Modification indexes (MI) may be used to add arrows to the model. The larger the MI, the more arrows will be added to the model, which will improve the model fit.
Assumptions in Path analysis:
Linearity: In path analysis, relationships should be linear.
Interval level data: In path analysis, data should be at interval scale.
Uncorrelated residual term: In path analysis, error term should not be correlated to any variable.
Disturbance terms: In path analysis, disturbance terms should not be correlated to endogenous variables.
Multicollinearity: In path analysis, low multicollinearity is assumed. Perfect multicollinearity may cause problems in the path analysis.
Identification: In path analysis, the path model should not be under identified. Exactly identified or over identified models are good for path analysis.
Adequate sample size: Kline (1998) recommends that the sample size should be 10 times (or ideally 20 times) as many cases as parameters.
Source: http://www.statisticssolutions.com/methods-chapter/statistical-tests/path-analysis/
Confirmatory factor analysis
Confirmatory factor analysis (CFA) is a multivariate statistical procedure that is used to test how well the measured variables represent the number of constructs. Confirmatory factor analysis (CFA) and exploratory factor analysis (EFA) are similar techniques, but in exploratory factor analysis (EFA), data is simply explored and provides information about the numbers of factors required to represent the data. In exploratory factor analysis, all measured variables are related to every latent variable. But in confirmatory factor analysis (CFA), researchers can specify the number of factors required in the data and which measured variable is related to which latent variable. Confirmatory factor analysis (CFA) is a tool that is used to confirm or reject the measurement theory.
Terms and concepts in confirmatory factor analysis (CFA):
Theory: In confirmatory factor analysis (CFA), theory is a systematic set of causal relationships that provide the comprehensive explanation of a phenomenon.
Model: In confirmatory factor analysis (CFA), model is a specified set of dependant relationships that can be used to test the theory.
Path analysis: In confirmatory factor analysis (CFA), path analysis is used to test structural equations.
Path diagram: In confirmatory factor analysis (CFA), the path diagram shows the graphical representation of cause and effect relationships of the theory.
Endogenous variable: In confirmatory factor analysis (CFA), endogenous variables are the resulting variables that are a causal relationship.
Exogenous variable: In confirmatory factor analysis (CFA), exogenous variables are the predictor variables.
Confirmatory analysis: In confirmatory factor analysis (CFA), confirmatory analysis is used to test the pre-specified relationship.
Cronbach’s alpha: In confirmatory factor analysis (CFA), Cronbach’s alpha is used to measure the reliability of two or more construct indicators.
Identification: In confirmatory factor analysis (CFA), identification is used to test whether or not there are a sufficient number of equations to solve the unknown coefficient. In confirmatory factor analysis (CFA) identifications are of three types: (1) underidentified, (2) exact identified, and (3) over-identified.
Goodness of fit: In confirmatory factor analysis (CFA), goodness of fit is the degree to which the observed input matrix is predicted by the estimated model.
The following are the procedures involved in confirmatory factor analysis (CFA):
1. Defining individual construct: In confirmatory factor analysis (CFA), first we have to define the individual constructs. In confirmatory factor analysis (CFA), the first step involves the procedure that defines constructs theoretically. This involves a pretest to evaluate the construct items, and a confirmatory test of the measurement model that is conducted using confirmatory factor analysis (CFA), etc.
2. Developing the overall measurement model theory: In confirmatory factor
analysis (CFA), we should consider the concept of unidimensionality between construct error variance and within construct error variance. At least four constructs and three items per constructs should be present in the research.
3. Designing a study to produce the empirical results: In confirmatory factor analysis (CFA), the measurement model must be specified. In confirmatory factor analysis (CFA), most commonly, the value of one loading estimate should be one per construct. In confirmatory factor analysis (CFA), two methods are available for identification. The first is rank condition, and the second is order condition.
4. Assessing the measurement model validity: In confirmatory factor analysis (CFA), assessing the measurement model validity occurs when the theoretical measurement model is compared with the reality model to see how well the data fits. In confirmatory factor analysis (CFA), to check the measurement model validity, the number of the indicator helps us. For example, in confirmatory factor analysis (CFA), the factor loading latent variable should be greater than 0.7. Chi-square test and other goodness of fit statistics like RMR, GFI, NFI, RMSEA, SIC, BIC, etc., are some key indicators that help in measuring the model validity in confirmatory factor analysis (CFA).
Confirmatory factor analysis (CFA) and statistical software: Usually, statistical software like AMOS, LISREL, EQS and SAS are used for confirmatory factor analysis (CFA). In AMOS, visual paths are manually drawn on the graphic window and analysis is performed. In confirmatory factor analysis (CFA) in LISREL, confirmatory factor analysis (CFA) can be performed graphically as well as from the menu. In SAS, confirmatory factor analysis (CFA) can be performed by using the programming languages.
Source: http://www.statisticssolutions.com/methods-chapter/statistical-tests/confirmatory-factor-analysis/
Friday, August 20, 2010
Is AMOS necessary to get a PhD?
 Source: IBM SPSS. Click to enlarge image
This is a big question posted by most participants of OUM's 3rd colloquium held in KL from Aug 7 - 8, 2010.
So should you use AMOS? Ask yourself these questions:
First, do your models have multiple regressions that are embedded within each other? Second, do you have latent variables in your models? If you answered yes to both or either of these questions, you probably need to apply structural equation models. AMOS may be the best option for you.
Generally there are many statistical tools available to assist us in analyzing our data. Among the popular ones are SPSS, LISREL, MPlus and MStat. How about AMOS? Well actually AMOS is an add-on of SPSS, which most of us are familiar with. Before we dwell further, lets look at some of the writings about AMOS.
What Is AMOS?
AMOS (Analysis of Moment Structures) is an add-on module for SPSS. It is designed primarily for structural equation modeling, path analysis, and covariance structure modeling, though it may be used to perform linear regression analysis and ANOVA and ANCOVA. It features an intuitive graphical interface that allows the analyst to specify models by drawing them. It also has a built-in bootstrapping routine and superior handling of missing data. It reads data from a number of sources, including MS Excel spreadsheets and SPSS databases.
Source: http://www.utexas.edu/its/help/spss/526
Overview of AMOS:

Build structural equation models with more accuracy than standard multivariate statistics models using intuitive drag-and-drop functionality
IBM® SPSS® Amos (formerly Amos™) gives you the power to easily perform structural equation modeling (SEM). Using SEM, you can quickly create models to test hypotheses and confirm relationships among observed and latent variables – moving beyond regression to gain additional insight.
Structural equation modeling (SEM) can take your research to the next level
When you conduct research, you’re probably already using factor and regression analyses in your work. Structural equation modeling (sometimes called path analysis) can help you gain additional insight into causal models and explore the interaction effects and pathways between variables. SEM lets you more rigorously test whether your data supports your hypothesis. You create more precise models – setting your research apart and increasing your chances of getting published.
IBM SPSS Amos is the perfect modeling tool for a variety of purposes, including:
* Psychology – Develop models to understand how drug, clinical, and art therapies affect mood
* Medical and healthcare research – Confirm which of three variables –confidence, savings, or research – best predicts a doctor’s support for prescribing generic drugs
* Social sciences – Study how socioeconomic status, organizational membership, and other determinants influence differences in voting behavior and political engagement
* Educational research – Evaluate training program outcomes to determine impact on classroom effectiveness
* Market research – Model how customer behavior impacts new product sales or analyze customer satisfaction and brand loyalty
* Institutional research – Study how work-related issues affect job satisfaction
* Business planning – Create econometric and financial models and analyze factors affecting workplace job attainment
* Program evaluation – Evaluate program outcomes or behavioral models using SEM to replace traditional stepwise regression
Features and Benefits:
IBM SPSS Amos makes structural equation modeling (SEM) easy and accessible
IBM SPSS Amos builds models that more realistically reflect complex relationships because any numeric variable, whether observed (such as non-experimental data from a survey) or latent (such as satisfaction and loyalty) can be used to predict any other numeric variable.
Its rich, visual framework lets you to easily compare, confirm and refine models.
Quickly build graphical models using IBM SPSS Amos’ simple drag-and-drop drawing tools. Models that used to take days to create are just minutes away from completion. And once the model is finished, simply click your mouse and assess your model’s fit. Then make any modifications and print a presentation-quality graphic of your final model.
Its approach to multivariate analysis encompasses and extends standard methods – including regression, factor analysis, correlation and analysis of variance. New capabilities include bootstrapping of user-defined functions of the model parameter for increased model stability.
Obtain Bayesian estimates of model parameters and other quantities
Bayesian analysis enables you to apply your subject-area expertise or business insight to improve estimates by specifying an informative prior distribution. Markov chain Monte Carlo (MCMC) is the underlying computational method for Bayesian estimation. The MCMC algorithm is fast and the MCMC tuning parameter can be adjusted automatically.
Perform estimation with ordered categorical and censored data Create a model based on non-numerical data without having to assign numerical scores to the data. Or work with censored data without having to make assumptions other than the assumption of normality. You can also impute numerical values for ordered-categorical and censored data. The resulting dataset can be used as input to programs that require complete numerical data.
Impute missing values or latent variable scores
Choose from three data imputation methods: regression, stochastic regression, or Bayesian. Use regression imputation to create a single completed dataset. Use stochastic regression imputation or Bayesian imputation to create multiple imputed datasets. You can also impute missing values or latent variable scores.
See how easy it is to use IBM SPSS Amos:
1. Select a data file:
 Click on picture to enlarge image
Input data from a variety of file formats (IBM® SPSS® Statistics, Micosoft® Excel, text files, or many others). Select grouping variables and group values. IBM SPSS Amos also accepts data in a matrix format if you’ve computed a correlation or covariance matrix.
2. Specify your model:
 Click to enlarge image
Use drag-and-drop drawing tools to quickly specify your path diagram model. Click on objects in the path diagram to edit values, such as variable names and parameter values. Or simply drag variable names from the variable list to the object in the path diagram to specify variables in your model.
3. Select analysis properties:

Select the analysis properties you wish to examine, such as standardized estimates of parameters or squared multiple correlations. Constrain parameters for more precise models by directly specifying path coefficients
4. View output:
 Click to enlarge image
IBM SPSS Amos output provides standardized or un-standardized estimates of covariances and regression weights as well as a variety of model fit measures. Hotlinks in the help system link to explanations of the analysis in plain English.
 Click to enlarge image
IBM SPSS Amos output provides standardized or un-standardized estimates of covariances and regression weights as well as a variety of model fit measures. Hotlinks in the help system link to explanations of the analysis in plain English.
5. Assess your model’s fit:
 Click to enlarge image
Make any modifications to your model and print publication-quality output.
System Requirements:
Operating system
* Microsoft® Windows® Vista® or Windows XP
Hardware
* Memory: 256 MB RAM minimum
* Minimum free drive space: 125 MB
Software
* Internet Explorer 6
* Microsoft .NET Framework 3.5 SP1 or higher
Source: http://www.spss.com/amos/
Example of an application of AMOS:
Antecedents and consequences of parasocial interaction with sport athletes and identification with sport teams.
RESULTS
Due to the limited sample size, the items of each construct were first summated to create single-item indicators. Structural equation modelling was then used to test the above hypotheses. The parsimony of this partially mediated structural model was appraised with the maximum likelihood method of parameter estimation via AMOS 4.0.
The overall model fit for the proposed model was not satisfactory ([chi square] =90.935, df= 20, p<.00 l; NFI =.984; RFI=.955; IFI=.987; TFI=.965; CFI=.987; RMSEA=. 134), since RMSEA is higher than .08 (Browne & Cudeck, 1993). Thus the original model was rejected and the modification indices were subsequently examined as a way of improving the model fit (Anderson & Gerbing, 1988). The modification indices showed that the model fit could be improved if the error (or unique) terms of parasocial interaction and team identification were allowed to correlate (the chi-square statistics would decrease by at least 53.456). Each error term represents much more than random fluctuations due to measurement error. It stands for anything else on which each variable may depend, but which are not measured in the model (Arbuckle & Wothke, 1999). Since parasocial interaction with favorite athletes and sport fan team identification both cover fans' sport involvement, it is reasonable to correlate their error terms. After the model modification, the goodness of fit statistics demonstrated that the modified model provided a much stronger fit ([chi square] =27.015, df= 19,p=. 104; NFI=.995; RFI=.986; IFI=.999; TFI=.996; CFI=.999; RMSEA=.046). Figure 2 shows the modified model and Table 2 reports the parameter estimates for causal paths.
Further reading: http://www.thefreelibrary.com/Antecedents+and+consequences+of+parasocial+interaction+with+sport...-a0227279262
Click here for the guide on AMOS 16:

http://www.amosdevelopment.com/download/Amos%2016.0%20User%27s%20Guide.pdf
Tuesday, August 17, 2010
Harvard ranked top U in US followed by Princeton and Yale - The Star
NEW YORK: Harvard pulled ahead of Ivy League rival Princeton in the latest edition of the influential U.S. News & World Report university rankings, while a stronger emphasis on graduation rates drove other changes in the Top 10.

America's oldest university and traditionally one of its most selective, Harvard has topped the list two of the last three years.
Last year, the two elite schools shared the top ranking.
Yale was the No. 3-ranked university this year, followed by Columbia, and Stanford and University of Pennsylvania tied at No. 5.
Williams College in Massachusetts was ranked the nation's top liberal arts school, repeating its feat of last year.

The most closely watched of a growing number of college rankings, the U.S. News & World Report list is both credited for helping students and families sort through a dizzying college selection process and criticized by those who say it's too arbitrary and pressures colleges to boost scores at the expense of improving teaching.
A change in how rankings are determined led to some shifts in the magazine's "Best Colleges" rankings, which were released online Tuesday and examine more than 1,400 accredited four-year schools based on 16 factors.
How did Harvard edge Princeton by 1 point on an 100-point scale? Robert Morse, director of data research for U.S. News & World Report, credited Harvard's higher scores on graduation rates, and financial and faculty resources.
The rankings take into account factors such as SAT scores, selectivity, graduation and retention rates, alumni giving and peer reputation. This year, high-school guidance counselors' opinions were added to the mix.
Most notably, graduation rate performance was given greater weight, accounting for 7.5 percent of the final score for national universities and liberal arts colleges, up from 5 percent last year. The variable is the difference between a school's actual graduation rate and one predicted by U.S. News based on test scores and schools' resources.
Morse said the shift helped Columbia University rise from eighth to fourth this year and contributed to Cal Tech and MIT falling from a tie for fourth to a tie for seventh.
Nationally, graduation rates are getting more policy attention as higher-education leaders and advocates focus increasingly not just on getting students in the door but also out with a degree or certificate. One of the Obama administration's signature education goals is for the U.S. to regain the world lead in college graduation rates by 2020.
The University of California, Berkeley is the highest-ranked public university, at No. 22 overall in the U.S. News report. Despite a severe budget crisis, five schools in the UC system were among the top 10 public universities.
More schools were ranked this year, a reflection of both increased consumer demand and improved data collection, Morse said. The survey now displays the rank of the top 75 percent of schools in each category, up from 50 percent. The schools in the bottom tier are displayed alphabetically and not given numeric rankings.
The magazine also publishes a list of "Up and Comers," based on a survey of college administrators who were asked to nominate schools they think are making promising and innovative changes. The University of Maryland-Baltimore County was No. 1 among national universities in that category — and ranked No. 159 overall.
Earlier this month, Forbes magazine ranked Williams College No. 1 in its third "America's Best Colleges" rankings — and Harvard No. 8. The business magazine weighs student satisfaction, graduation rates, student debt and other factors. - AP
Overcoming Problems in Studying for a PhD
How to Overcome Difficulties With a Doctorate or Graduate School
Aug 12, 2009 By Alistair McCulloch
When students begin to study for a PhD or enters a new graduate school, they begin a highly significant period in their life. A PhD, or doctorate, involves making a contribution to knowledge and can also result in significant changes in the way the student thinks about the world.
However, because a PhD involves this sort of transformational experience, and also because it takes a minimum of three years and sometimes more than ten, real problems can emerge during the period of study. Here are the main problems with studying for a PhD.
Problems With Identifying a Good Research Topic
A good research topic is vital to a good PhD. It must be rooted in the academic literature, as this is one of the functions of the literature review, to identify an issue that no-one else has approached in the way the student intends.
Loss of Motivation
The best way to avoid loss of motivation is for students to really know why they want to do a PhD and to select a topic, institution and supervisor that they know will excite them for the long run. Understanding motivation will also help the institution (through the supervisor) support and encourage the student in the best way.
Experiments That Don’t Work
All scientists know the frustration that can arise when an experiment doesn’t work. If this happens to a research student, he should seek help from his fellow students, from the supervisor, from other researchers in the department and also from scientists working at other Universities and research laboratories.
Problems With Data-Collection
Sometimes social science research students face problems collecting their data. This can be due to difficulties in recruiting respondents. Sometimes their responses will not allow students to address their research questions in the way they had expected. If numbers of respondents are insufficient, the selection criteria may be extended or the number of case studies increased. If the responses are not what was expected, there may be an opportunity to revise the theory or model being tested and this may result in a better thesis.
Isolation
The further a student gets into his PhD, the more likely he is to experience isolation, a consequence of studying something completely original. Joining student societies and trying to maintain a life outside university are two ways of combating this. If there’s no doctoral student society in place, a student could try to organise one.
Running out of Money
PhD students on grants often find it very difficult to complete their studies once their grant has run out, and part-time students are likely to find it hard to make ends meet throughout their studies. It is possible to suspend a doctoral registration, but it is not uncommon that students who do this find it hard to re-start. If it is essential that a suspension be put in place, students should keep in touch with both their research project and their supervisor during the period of suspension. Maintaining links improves the chances of eventual completion considerably.
Problems With a Supervisor
Problems with a research degree supervisor can arise from overwork, personality clashes, a change of topic or a multitude of reasons. Whatever the reason, it is important that the student discuss the situation openly with the supervisor. If that is impossible, go to the Departmental Research Degree Coordinator or the Graduate School. If none of these are possible, talk with the student union or student association. It is a student’s right to have good supervision and a university’s failure to provide it leaves it liable.
What if Someone Publishes a Student’s Original Idea Before He Does?
A student shouldn’t worry about this because it very rarely happens. If it does, and it is worth reiterating that the chance of someone reproducing independently a student’s programme of work is very, very slim. In that case, re-orientate the thesis so that it focuses on a different aspect of the research. Think about drawing on a different aspect of the literature review or do some additional empirical work to move the idea on. The latter option may not be a satisfactory situation, but it may well save the doctorate the student has put so much work into.
Read more at Suite101: Overcoming Problems in Studying for a PhD: How to Overcome Difficulties With a Doctorate or Graduate School http://graduate-schools.suite101.com/article.cfm/overcoming_problems_in_studying_for_a_phd#ixzz0wpSpZoQ1
The PhD journey: how to choose a good supervisor
Shared interests are the building blocks of your relationship
"Choosing a supervisor is tricky because you don't know much about them until you start working with them," says Lewis Wolpert, professor of biology at University College London. "Instead, start by choosing a problem that interests you - it's easier to do and just as important."
"It might sound obvious," says Jim Hough, director of the Institute for Gravitational Research at the University of Glasgow, "but it's amazing how many students don't do that."
John Cowpe, a second-year PhD student from the University of Salford, agrees. "To get the most from your supervisor, you have to be interested in what they do. My supervisor will leap at any chance to discuss - often at great length - a topic he's passionate about. You learn just as much from anecdotal chatting as you do from your own research."
A good supervisor says all the right things
Your supervisor will be a mentor, friend, confidante, adviser and also a voice of reason, so make sure it's a voice you'll want to hear. "Over the course of three years, it's crucial to have someone who can encourage you when your experiments fall flat, challenge you when you become cocky and help steer you towards successfully submitting your thesis," says broadcaster and writer Simon Singh, who did a PhD in particle physics at the University of Cambridge.
Choose a supervisor who excites you
It is essential to find a supervisor you believe in and whose work you find exciting, says Susan Greenfield, professor of physiology at the University of Oxford. "Scientists are made up of all types of people - thinkers, dreamers, practical workers - all of whom are important, but you need to find someone who thinks in the same way that you do."
You'll see many of your peers going to the City and into industry, earning much higher salaries than you, and who also seem to have more time off, says Greenfield, "so it's vital that you have a real passion and belief in your work".
Supervisors can be stereotyped - pick your favourite
So says David Hand, professor of mathematics at Imperial College London. "At one extreme, there are the most eminent senior academics with considerable experience. Their reputation and influence can rub off and they can introduce you to other big names, but they may not be able to give you as much of their time as is desirable."
At the other extreme is the junior academic, says Hand. While they have less experience, they have more time to spend on your project. This is an important factor to consider, says Vivienne Raper, a recent PhD graduate from the University of Bristol. "If you're not at your most motivated, an absent or distant PhD supervisor can be a recipe for months of procrastination."
Another option is to choose a supervisor close to retirement, suggests second-year PhD student Stefan Rohrmoser from the University of Southampton. "They are more likely to have a relaxed attitude, as they've seen it all before. Their students won't be running blindfolded into an overly ambitious project. They will be given interesting work which their supervisor knows is going to provide enough results to comfortably finish a PhD."
Personal chemistry is important
Once you've found a supervisor you'd like to work with, go and meet them, says Greenfield. "The real issue is to see whether the chemistry is right," she says. "Think about whether your prospective supervisor seems like the sort of person who will be there when you need them."
While you're visiting potential supervisors, try to meet some of their current students as well as other colleagues in their group. "I always tell PhD candidates to talk to my students," says Carolyn Stephens, senior lecturer in international environmental health at the London School of Hygiene and Tropical Medicine. "They know things about me that I don't know myself."
You can get a real feel for the mood of a department by chatting to current PhD students, agrees Singh. "Buy them a coffee and a doughnut, and ask them if they enjoy being part of the research group."
See a variety of people
If you have the opportunity to sample different supervisors at the beginning of your PhD, definitely take it, says Gerd Gigerenzer, director of the Max Planck Institute for Human Development in Berlin. "That gives you more time to work out who you would work best with."
Research councils are also starting to move towards multidisciplinary projects, which means you might get to work with more than one team, says Stephens. "There's a lot of encouragement to cross boundaries between disciplines. If this is the case, make sure your supervisor is willing to put you in touch with scientists from other subjects."
You will also find help from those closer to home. "Remember that on a day-to-day basis you will spend more time working with students and postdocs than your supervisor," says Hough. "So it's important that there's a good social environment. Usually that means a reasonable-sized group." This was important for Singh: "Being surrounded by postdocs, lecturers and other postgraduates willing to advise and guide me was invaluable."
Keep channels of communication free from static
If you feel like your supervisor is talking in a foreign language, don't panic. "Often in one-to-one meetings, you will understand what your supervisor says at a basic level, but will only have a good grasp of the implications and ramifications towards the end of your PhD," says Hand. "Don't be afraid to ask questions if you don't understand," agrees Gigerenzer. "Openness is key."
Prepare to take the reins
"A PhD is part apprenticeship and part equal partner. Ideally, the balance between these two modes shifts to the latter as time goes on," says John Krebs, professor of zoology at the University of Oxford. "It's a bit like learning to ride a bike," says Greenfield. "You start off on the back of your mother's bike. Then you get your own tricycle, then a two-wheeled bike with stabilisers. Finally your stabilisers are removed."
Science shouldn't be too safe; you shouldn't be too protected, she says. "Being trained to cope with failure is one of the most important parts of your PhD. If you don't know failure, then you're not being stretched enough." That said, you will reach the point where you know more than your supervisor about a specific aspects of your research. "This should certainly be your goal," says Gigerenzer.
Source: http://www.newscientist.com/article/mg19726442.500-the-phd-journey-how-to-choose-a-good-supervisor.html
Friday, August 13, 2010
Happy days: Why PhD students need a helping hand from their supervisors - The Independent
February 14, 2008
By Suzanne Lynch

For most students, having a supportive supervisor is crucial to their chances of successfully completing a PhD. But tales of woe remain commonplace - despite reforms.
Laura began a PhD in Chinese cultural studies in 2003, but within months realized that something was wrong. "After six months, I became worried. I had only met my supervisor once, and I seemed to have no plan or sense of direction," she says. "Although my department had seemed delighted to accept me as a PhD student - even awarding me a studentship - it soon became clear that my supervisors knew nothing about my subject. I began to realize that the only reason my department had taken me on was to broaden their research profile."
Things deteriorated rapidly. Her supervisor showed no interest in her work, and communication broke down completely. Despite repeated complaints to her department, nothing was done to resolve the situation.
Eventually, four years into her PhD, Laura finally found two supervisors from another department within her university who were prepared to take her on. Although her PhD is finally on track, she is bitter about her experience. "It makes me so angry," she says. "Supervisors are in such a position of power that students are afraid to stand up to them. It's as if they're untouchable, above the law."
Laura's experience is not unique. Tales of PhD woe are ten-a-penny among graduate students - and the vast majority of these involve problems with supervisors. Last year, more than a third of complaints received by the Office of the Independent Adjudicator, the body that handles individual complaints against Higher Education Institutions, were from postgraduate students.
One of the main problems is that for many PhD students, the supervisor-supervisee relationship is pivotal to the successful completion of their PhD.
This was confirmed by last year's Postgraduate Research Experience Survey (PRES), the first national survey of postgraduate students. It found that the vast majority of postgraduates - more than 95 per cent - rated supervision as the single most important factor affecting their research experience and their ability to finish their PhDs on time.
As Derek S. Pugh of the Open University, co-author of How to Get a PhD, says, supervision can make or break a PhD. "Mostly the system works well and poor supervision is the exception rather than the norm," he says. "But when it does break down, it can go disastrously wrong and have serious consequences."
David, a former PhD student, knows just how detrimental a poor supervisor can be. He began a PhD in 2006 but quit after a year. "I knew straightaway that there was a problem with my supervisor," he says. "I thought it was odd that I had no contact with him before starting the PhD, and when I arrived my suspicions were confirmed. He was never around, and there were never any opportunities for regular supervisions. Even though I was working on a prestigious project, it was just myself and an inexperienced postdoc in the lab and I had no direction or support."
Things came to a head during David's first year review, when his supervisor told him that he wasn't cut out for a PhD and accused him of faking results. Although David complained to his head of department who did take his side, he decided eventually to drop out.
"Because of funding, I was tied to the project, so I couldn't change my supervisor," he says. "My biggest gripe with him was that he was accepted me on to this programme knowing I had no background in the specific field and yet offered so little support."
It's not all bad news though. Despite stories such as David and Laura's, things are changing in the field of postgraduate supervision.
"There have been real changes in the past decade or so," says Professor Chris Park, director of the Graduate School at Lancaster University.
"While traditionally in the UK, the 'secret garden' model - whereby supervisor and supervisee worked together, out of sight - was the norm, now the system is becoming more transparent and accountable."
One reason why universities may have become more accountable is that in the late 1990s a series of court cases were taken by PhD students against their institutions. Kevin Wilkinson took legal proceedings against Aston University for not providing him with a supervisor when he arrived to do a PhD in 1997. Similarly, one-time PhD student Neil McDougal brought a case against the University of Bath over poor postgraduate supervision. Cases like these have meant that universities have had to pull up their socks and become more responsive to their research students.
One of the main changes that has taken place in recent years has been reform of the supervisory structure itself. Nowadays, most students signing up for a PhD will be assigned at least two supervisors, typically a main supervisor and co-supervisor. Supervisory teams are also common.
Although some believe that this system generates its own problems, it does ensure that PhD students have access to a broader range of supervisory advice and support and have a fall-back plan if their relationship with their principal supervisor goes wrong.
Huge steps have also been taken in supervisor training. For years, PhD supervisors were expected to get on with the job with little training or support in how to manage or direct PhD students. Now most universities require their staff to do courses in research student supervision.
University College London (UCL) is one institution that has embraced changes in their policy of research student supervision. PhD students at UCL are assigned a primary and secondary supervisor, and all students are required to keep an electronic log-book which has to be validated by their supervisor.
The university has also capped the number of students PhD supervisors are permitted to supervise, with academics being limited to six full-time doctorate students. According to Professor Michael Worton, vice-provost of UCL, these changes are hugely important - and not just for the PhD students.
"Our main focus is to ensure that our PhD students have the best possible research experience, but having a clear and transparent system in place also has enormous benefits for the supervisors," he says.
"The relationship between supervisor and PhD student can potentially be one of the most rewarding academic partnerships. Working with PhD students helps keep academics invigorated and in touch with new developments in their research field. PhDs are our colleagues of the future."
Corrinne Burns is a PhD student who has an excellent relationship with her supervisor. She is in the second year of a PhD researching anti-malarial drugs in plants at De Montfort University.
She starts each day with a cup of tea with her supervisor and at the end of each month has an official meeting with him.
"My supervisor is always very approachable and supportive and treats me like a colleague," she says. "Having such regular contact also helps to keep the project on track and makes all the difference."
But what are the options for students whose supervisor experience is not so positive? "If you are having problems with your supervisor, try to deal with the problem locally," says Chris Park. "First, approach the head of department. If that doesn't yield results, the next port of call should be someone at an institutional level such as the dean of graduate studies. Failing that, you can move outside your institution and make an official complaint to the Office of the Independent Adjudicator."
The main thing, Park stresses, is that anxious PhD students should not suffer in silence and should look for help.
"There are plenty of mechanisms now in place to help them. It's up to students themselves to take the initiative and make sure they take advantage of the support that's available."
How to manage your supervisor
Go to your tutorial with a list of topics for discussion
Help your supervisor give you better feedback on your work by always asking supplementary questions to make sure that you understand fully what you have to do.
Ensure that every time you leave a tutorial you have agreed and noted a date for the next one. Be punctilious in meeting appointments and deadlines so that your supervisor will be too.
Criticism is part and parcel of the PhD experience, but it should be constructive.
Ensure that you are clear about what is being criticised and how to put it right. If in doubt, ask your supervisor to clarify. Never leave a tutorial without fully understanding what is expected of you.
Avoid inappropriate personal relationships with your supervisor.
Be enthusiastic! Remind them of why your work is important. Your enthusiasm for your subject will rub off!
Keep a log and a written summary of your tutorial and send it to your supervisor - it will help to keep both parties on track.
From 'How to Get a PhD', co-authored by Derek S. Pugh
Source: http://license.icopyright.net/user/viewFreeUse.act?fuid=OTUyMzk3OA%3D%3D
Tuesday, August 10, 2010
Public Lecture by YABhg Tun Dr. Mahathir Mohamad

 Tun Dr. Mahathir delivering his lecture
OUM is proud to organize another public lecture today and the presenter is none other than our beloved former PM of Malaysia, YABhg Tun Dr. Mahathir Bin Mohamad. The title of his lecture was "Impact of Technology on the Future of Higher Education".
 Tan Sri Dr. Anuwar Ali delivering his welcoming address
 Tun Dr. M launching the e=learning innovations, witnessed by Tan Sri Azman Hashim (Pro-Chancellor of OUM) and Emeritus Prof Tan Sri Anuwar Ali (President and Vice Chancellor of OUM). Pix courtesy of The Star
The event which started at 9.30am was held at the Seri Pacific Hotel Ballroom in KL on 10 August 2010. Close to 1,000 people from all over Malaysia and even as far as Yemen, came to listen attentively to Tun's lecture. It was a frank and well thought lecture where Tun shares his years of experience about the the impact of technology especially the Internet on education.
 Tun Dr. Mahathir shaking hands with participants after delivering his lecture
 Tun Dr. Mahathir was met by reporters
Earlier, YBhg Tan Sri Dr. Anuwar Ali, President and Vice Chancellor of OUM gave a welcoming speech and provide insight of the various e-learning technology developed by OUM. YABhg Tun was given the honor to launch the new E-Learning Innovation.
 The launching of OUM's e-learning innovation
Multimedia presentation of E-Learning Innovation
In his lecture, Tun Dr. M, as he is fondly known, emphasized on the need to create new ideas and knowledge to address the problems caused by technology itself. He was very concerned about the overwhelming knowledge available on the net especially pornographic materials which has caused a lot of social problems in Malaysia lately.
In order to obtain the knowledge one must have a good grasp in English as it is the international language. He was disappointed that after he retired from the government, the teaching of Math and Science using English mooted by him has been reversed back to the Malay language. This was due to certain groups of people who misconstrue that learning the English language makes one less patriotic.
Video clip of Tun Dr. M's lecture - Part 1
Video clip of Tun Dr. M's lecture - Part 2
He said that technology today is more powerful and should be capitalized to improve our knowledge. He was glad that OUM has implemented various e-learning efforts to help make education available to all at an affordable fee. With technology, learning has just begun. The younger generation learns faster than the elderly as their mindset has not changed. He confessed that he himself find it difficult to use the PC and the various programs, nevertheless, it is important for us to use it in order to gain the knowledge that we required.
At the end of his one and half hour lecture, participants were given opportunity to ask Tun on various issues. When asked about the one thing he will do if the clock were to turned back 22 years ago, Tun said there are many things he could do as a PM and the one thing he wanted to do and he could do is to enforce the teaching of math and science in English successfully.
When asked to suggest to narrow the gap of digital divide especially between students and teachers, Tun Dr. M candidly suggested that the teachers must be very old and ought to retire. He said teachers should equip themselves with more knowledge than their students.
 Tun Dr. M on air via OUM's i-radio
Video clip of I-Radio interview with Tun Dr. M
The lecture ends at 11.00am and Tun Dr. Mahathir then made a visit to OUM main campus to look at the new technology used at OUM. Tun Dr. M was also interviewed live via i-radio of OUM by Prof. Dr. Zoraini and accompanied by Tan Sri Anuwar Ali and Prof. Dr. Mansor Fadzil.
 Tun Dr. M meeting staff of OUM at OUM's main campus
 Tun Dr. Mahathir was seen leaving OUM after lunch
Sunday, August 8, 2010
OUM 3rd PhD Colloquium
 Dato' Ahmad delivering his keynote address
 Part of the participants of the colloquium
The 3rd PhD OUM Colloquium was held at OUM Main Campus on 7th - 8th August, 2010. YBhg Dato' Ir. (Hj) Ahmad Zaidee Laidin, Academy of Science Malaysia has been kind enough to deliver his very enlightening keynote address entitled: "Innovation and Excellence in Research", to a group of over 60 PhD students of OUM who have come from as far as Sarawak and Singapore.

 Tan Sri Dr. Anuwar Ali presenting a token of appreciation to Dato' Ahmad witnessed by Prof. Dr. Mohd Ghazali
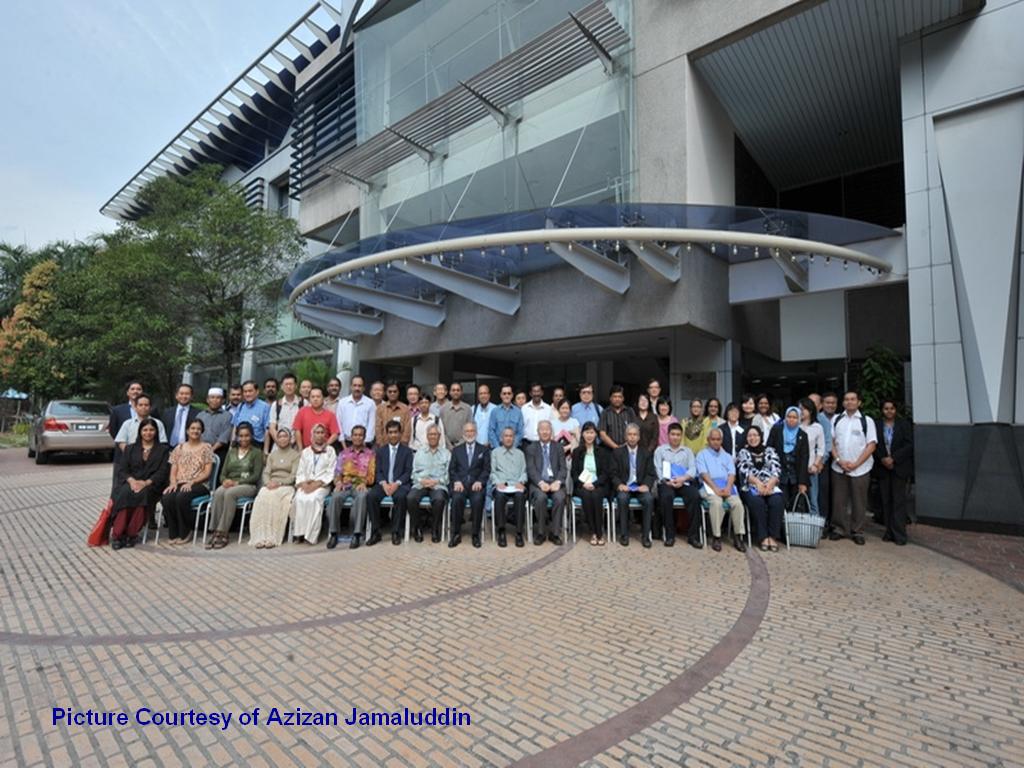 One for the album
Earlier, Emeritus Professor Tan Sri Anuwar Ali, President/Vice Chancellor of OUM delivered has welcoming address. Also present were Prof. Dr. Mansor Fadzil, Senior VP of OUM, Prof. Dr. Rosli, VP of OUM, Prof. Ramli Bahroom, Financial Controller of OUM and Prof. Mohd Ghazali, Dean of the Centre for Graduate Studies.
 Dr. Nagarajah facilitating the session on research instrument development.
 Part of the participants during the workshop assisted by Prof. Dr. Zuraidah (black jacket)
 Part of the participants during tea break
During the 2-day colloquium, participants were exposed to matters related to the development of research instruments and the various statistics to test the models by Associate Prof. Dr. Nagarajah Lee and Associate Prof. Dr. Chung. A hands-on workshop were also conducted on how to use AMOS.
 Seng Poh presenting her mock viva
 Siow Ming presenting her mock viva
At the end of the colloquium, 2 PhD students who are waiting for their viva, Siow Ming and Seng Poh, were invited to present their Mock Viva.
 Patrick Wong (left) and Richard Ng (right) were the other 2 PhD candidates waiting for their viva
Generally the participants were very satisfied with the colloquium. A big syabas to Prof. Ghazali, Dean of the Centre for Graduate Studies of OUM and his team for organizing this colloquium.
Subscribe to:
Posts (Atom)